HelloVcard WhatsApp Store Analytics: How to Track and Grow Your WhatsApp Orders
HelloVcard analytics track every card view, QR scan, and WhatsApp Store link click — free on every plan. This guide covers which metrics matter for WhatsApp Store owners and how to use the data to increase orders without increasing effort.
Written by L K Monu Borkala | Founder, OneCity Technologies | Published: 31 May 2026 | Updated: 3 June 2026
Quick Answer: HelloVcard analytics track every card view, QR scan, and link click — giving you data on which channels drive the most catalogue views and which products generate the most WhatsApp enquiries. Free on every plan. This guide covers how to read your analytics and use the data to increase WhatsApp Store conversions.
Most small businesses using WhatsApp to sell have no idea which channel sends them the most customers. They post on Instagram, share links in WhatsApp groups, print QR codes on packaging, and add their card to their email signature — and when an order comes in, they cannot tell which of those four actions generated it. HelloVcard analytics change that.
11,380 interactions have been tracked across 178 active HelloVcard cards. That data reveals consistent patterns: which channels convert, which time of day drives the most scans, and which products in a WhatsApp Store generate the most enquiries. This guide covers how to access and act on that data for your specific business.
What HelloVcard Analytics Tracks
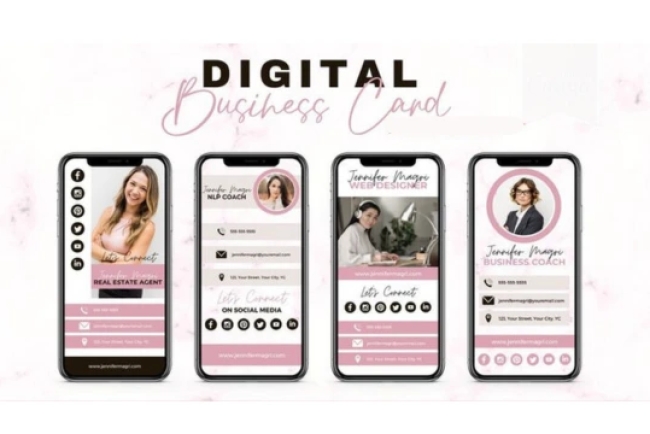
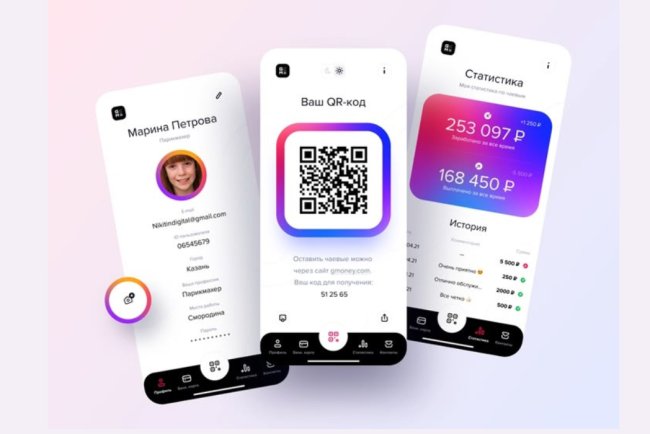
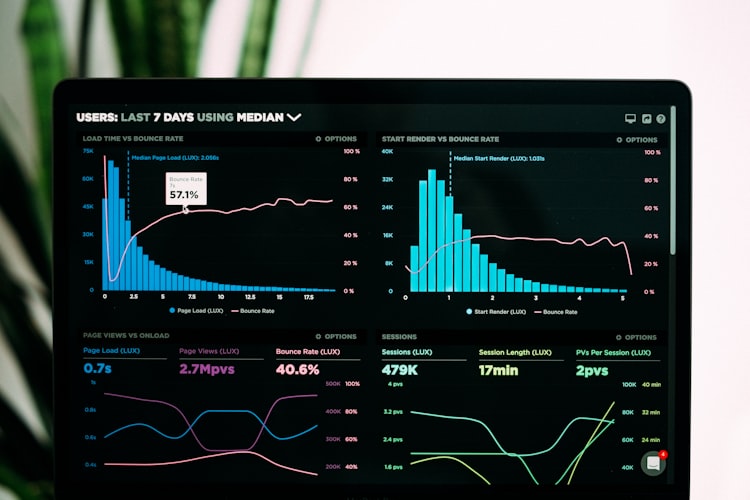
HelloVcard analytics tracks total card views (every time someone opens your card URL), QR scans (every time your QR code is scanned), link clicks (every time a visitor taps a link on your card, including your primary CTA and WhatsApp Store products), and geographic data where available. All of this is visible from your HelloVcard dashboard at no additional cost — analytics are free on every plan including the free forever tier.
The Four Metrics That Matter for WhatsApp Store Owners
Card views: the total number of times your card has been opened. This is your top-of-funnel metric. A consistently growing view count means your distribution is working. A flat or declining view count means you need to activate more distribution channels or refresh your WhatsApp status and social bio links.
QR scan rate: the proportion of card views coming from QR scans versus direct URL clicks. A high QR scan rate means your physical deployment (packaging, table tents, signage) is working. A high URL click rate means your digital channels (Instagram bio, email signature, WhatsApp status) are driving traffic. Neither is better — different businesses have different channel mixes.
CTA click rate: the percentage of card viewers who tap your primary CTA button (your WhatsApp link or booking link). A low CTA click rate despite high card views suggests your CTA is not compelling, your designation is not specific enough, or your product catalogue is not visible enough on first view.
WhatsApp enquiry conversion: the ratio of CTA clicks to actual WhatsApp conversations started. This is partly tracked through your WhatsApp conversation history. If many people tap your WhatsApp CTA but few actually send a message, your pre-filled message may be creating friction — simplify it to "Hi, I want to order" or remove it entirely.
Using Analytics to Improve Your WhatsApp Store
Monthly analytics review takes 10 minutes and answers three questions: which channel is driving the most card views, which CTA is getting clicked, and whether views and clicks are trending up or down month on month.
If Instagram bio is driving 70% of views but email signature is driving 70% of CTA clicks, your email audience is more purchase-intent than your Instagram audience. Invest in more direct email outreach and less Instagram content creation. If QR scans from packaging are the biggest driver, invest in wider packaging distribution — more deliveries, better QR placement on the packaging itself. Data-driven channel allocation is the most efficient path to growing WhatsApp orders without increasing total effort. See how shops boost sales with WhatsApp Store for conversion rate benchmarks by business type.
Interpreting Analytics for Different Business Types
For a home bakery: high QR scans from packaging mean your existing customers are re-engaging. Low Instagram bio clicks mean your Instagram followers are not converting to card visitors. Action: post your HelloVcard URL in a WhatsApp status update to your contact list and compare the resulting card view spike to your Instagram-driven baseline.
For a consultant: high LinkedIn Featured clicks with low CTA conversion suggests your card is not immediately communicating your value proposition. Review your designation and ensure your booking link CTA is the first visible action on your card. See digital business card for consultants for card optimisation guidance.
For a restaurant: high table tent QR scans mean dine-in customers are engaging with your catalogue. Track whether scan volume increases after adding new dishes to your WhatsApp Store — this tells you whether menu updates drive incremental engagement. Use the data to time new dish launches with your marketing posts for maximum impact.
Frequently Asked Questions
Are HelloVcard analytics free?
Yes. Card views, QR scans, and link clicks are tracked and displayed free on every HelloVcard plan, including the free forever tier. This is a significant advantage over competitors like HiHello and Blinq, which restrict analytics to paid plans. See HelloVcard pricing for a full feature comparison by plan.
Can I see which specific product in my WhatsApp Store gets the most enquiries?
HelloVcard analytics tracks overall link clicks including WhatsApp Store product clicks. For product-level enquiry tracking, cross-reference your HelloVcard analytics with your WhatsApp conversation history — the pre-filled product name in each enquiry message tells you which specific product drove each conversation.
How often should I check my HelloVcard analytics?
Weekly for active campaigns (when you are running a WhatsApp status push or a new product launch). Monthly for baseline tracking. The data is most actionable when reviewed consistently over time — a single snapshot tells you less than a trend across 8 to 12 weeks.
Benchmarking Your Analytics Against Industry Data
HelloVcard's aggregate platform data provides useful benchmarks for individual business owners reviewing their analytics. Across 178 active cards with 11,380 tracked interactions, the average card generates approximately 64 interactions. Cards with WhatsApp Store integration consistently generate higher interaction rates than cards without — because the WhatsApp Store gives viewers a reason to spend more time on the card and take a specific action. Cards with professional headshots generate higher QR save rates than cards with logos. Cards with Calendly or WhatsApp booking CTAs generate higher first-action rates than cards with generic website CTAs.
Use these benchmarks to evaluate your own analytics. If your interaction rate is significantly below the platform average, audit your card against these variables: does it have a professional headshot? Does it have a specific, outcome-focused designation? Does it have a WhatsApp Store or at least a clear product/service listing? Is the primary CTA a direct action (WhatsApp, booking) rather than a passive one (website, portfolio)? Address the gaps in priority order and track the impact on your weekly interaction rate. According to Google Analytics best practices and conversion rate optimisation principles, even small improvements in clarity and CTA specificity compound into significant conversion rate improvements over 90-day measurement windows.
Setting Up a Monthly Analytics Review Process
A structured monthly analytics review takes 15 minutes and generates one actionable insight per month. The process: log into your HelloVcard dashboard on the first day of each month, note your total card views, QR scans, and CTA clicks for the previous month. Compare to the month before — are views up or down? Is your CTA click rate (clicks divided by views) improving or declining? Write one number to improve next month and one specific action to improve it.
This one-insight-per-month approach is deliberately minimal. Freelancers and small business owners who try to optimise everything simultaneously make no measurable progress because they cannot isolate which change caused which result. Optimise one variable per month — your CTA in month one, your designation in month two, your WhatsApp Store product descriptions in month three — and you will have a data-driven card optimisation history that clearly shows what works for your specific audience and distribution channels. See WhatsApp Store analytics guide for the complete measurement framework.
Analytics for Seasonal Business Planning
HelloVcard analytics data accumulated over 6 to 12 months reveals seasonal patterns in your card view and enquiry volume. A home baker might see a consistent spike in the 3 weeks before Diwali. A wedding photographer sees peaks in October to December and February to April. A tax consultant sees a peak in January to March. These patterns, visible in your monthly analytics history, allow you to plan your distribution campaigns, WhatsApp status schedule, and catalogue updates around your demand peaks.
The businesses that grow most consistently on HelloVcard are those that treat their analytics as a planning tool rather than just a reporting tool. Looking backward at last month tells you what happened. Looking forward — "my analytics show I always see a 3x view spike in October, so I need to update my catalogue and QR deployment in September" — tells you what to do next. Build this forward-looking habit into your analytics review process from the first month you start tracking data. For seasonal campaign strategy, see WhatsApp status for daily visibility and how shops boost sales with WhatsApp Store.
Sharing Analytics Insights With Your Team
For businesses with staff, sharing HelloVcard analytics data with the team that handles WhatsApp conversations creates alignment between the customer acquisition system (your card and QR distribution) and the conversion system (your WhatsApp response process). If analytics show a spike in card views after a WhatsApp status post, the team knows to expect higher enquiry volume the following 24 to 48 hours and can prepare accordingly — ensuring fast response times when inbound interest is highest.
This connection between marketing activity (card distribution and status updates) and operational capacity (team WhatsApp response availability) is the difference between a WhatsApp Store that converts its traffic and one that generates interest but loses orders to slow responses. Share your weekly analytics summary with anyone on your team who handles customer conversations. The number is simple: card views this week, enquiries this week, orders completed this week. That three-number summary tells your team everything they need to know about whether the system is working.
Advanced Analytics: Combining HelloVcard Data With WhatsApp Conversation Data
HelloVcard analytics tracks the top of your conversion funnel — card views, QR scans, and link clicks. Your WhatsApp conversation history tracks the bottom — enquiries received, orders confirmed, and revenue generated. Combining these two data sources gives you a complete picture of your conversion funnel from initial card view to completed order.
The calculation is straightforward: card views (HelloVcard analytics) divided by WhatsApp enquiries (count your WhatsApp conversations initiated from HelloVcard) gives you your catalogue conversion rate. WhatsApp enquiries divided by completed orders gives you your conversation-to-order rate. These two rates, tracked monthly, tell you exactly where in your funnel to focus improvement effort. If catalogue conversion is low (under 10%), your card or catalogue needs improvement. If conversation-to-order is low (under 40%), your follow-up process or pricing needs improvement. Fix the weaker rate first — it generates the most incremental revenue for the least effort.
Using Analytics to Justify HelloVcard Investment to Business Partners
For freelancers with business partners, home businesses with spouses who question the expense, or small business owners who need to justify tool costs to themselves, HelloVcard analytics provides the data to make the case clearly. A business generating 20 direct WhatsApp orders per month at an average order value of Rs.500 generates Rs.10,000 in monthly revenue attributable to HelloVcard. The Rs.99/month platform cost represents a 1% overhead on that revenue — a cost-to-revenue ratio that compares favourably to any other marketing or business tool available.
Present this calculation to any stakeholder who questions the HelloVcard investment: monthly direct order revenue from HelloVcard minus the Rs.99 platform cost equals net value generated. Add to this the commission saved on any orders that would otherwise have gone through a delivery platform. Add the estimated value of customer relationships built through direct WhatsApp connections — long-term repeat business that would not exist without the direct channel. The combined ROI of HelloVcard for any business generating consistent WhatsApp orders is overwhelmingly positive by any standard measurement framework. For more on measuring and communicating HelloVcard value, see HelloVcard advantages for professional networking and advantages of HelloVcard WhatsApp Store.
Analytics Benchmarks for Different Business Types
Understanding what good analytics looks like for your specific business type helps you interpret your data accurately. For a home food business with active packaging QR deployment: a healthy card view rate is 50 to 150 views per month, with a CTA conversion rate of 20 to 35 percent (meaning 10 to 50 WhatsApp enquiries per month). For a freelancer with active LinkedIn distribution: 80 to 200 card views per month, with a booking link click rate of 10 to 20 percent. For a restaurant with table tent QR deployment: 100 to 400 card views per month during operating hours, with a WhatsApp enquiry rate of 15 to 25 percent of catalogue viewers.
If your metrics are significantly below these benchmarks, the issue is usually one of three things: insufficient distribution (your QR is not reaching enough people), weak card design (your designation or CTA is not compelling), or catalogue gaps (your product listings are missing images, prices, or descriptions that would convert browsers into enquiries). Review each variable systematically and make one targeted improvement per month. Analytics without action is just data — the value is in the monthly improvement cycle that the data makes possible. See WhatsApp Store analytics guide for the complete measurement framework and improvement process.
Using Analytics to Time Your WhatsApp Status Updates
HelloVcard analytics shows when your card receives the most views throughout the day and week. For most small businesses, peak card view times align with peak WhatsApp activity — morning commute (8 to 10am), lunch break (12 to 2pm), and evening (7 to 9pm). Your WhatsApp status updates reach your saved contacts during their active WhatsApp sessions — so posting your status at 8am, 12pm, or 7pm consistently generates more status views than posting at 2pm on a weekday afternoon when your audience is at work and less likely to be browsing WhatsApp.
Cross-reference your HelloVcard analytics card view timing with your WhatsApp status view timing (visible in WhatsApp status analytics) to identify the specific windows when your audience is most active and most likely to convert a status view into a catalogue browse or WhatsApp enquiry. This timing optimisation — posting your weekly status at your audience's peak activity window rather than whenever you happen to remember — is a free, zero-effort conversion improvement that most businesses do not apply. See WhatsApp status strategy for the complete timing and content guide.
Making Analytics a Business Habit
The businesses that grow fastest on HelloVcard are those that treat analytics as a weekly habit rather than an occasional check. A 5-minute weekly analytics review — total views this week versus last week, CTA clicks this week, any unusual spikes that indicate a distribution channel working — creates a feedback loop that continuously improves your card performance and distribution strategy. Businesses that review analytics weekly consistently outperform those that check monthly, because they catch distribution failures early (a QR code that stopped scanning, a broken link, a status update that generated no views) and fix them before they cost a week of lost orders. Schedule your weekly analytics review for the same day and time each week. Make it as routine as checking your WhatsApp inbox. The data will tell you what your customers are responding to — and that information, acted on consistently, compounds into measurable business growth over 12 months. See how shops boost sales with WhatsApp Store for the growth strategies that analytics enables.
Start tracking which channels drive your WhatsApp orders. Create your free HelloVcard — analytics included on every plan.
What's Your Reaction?